利用Docker快速搭建Prometheus监控及告警平台
开源项目出现让IT产业得到了蓬勃发展的机会,大批的社区贡献者通过向开源社区贡献代码实现自我价值。企业通过使用开源项目,增加了对核心技术的掌控能力。虽然开源项目从功能性上是基本可用的,但是需要从用户体验、运维层面投入人力,本文目的就是帮助读者利用Docker快速构建一套基于Prometheus的监控及告警平台,能够实现对用户环境基本监控,本文将持续更新,收集好用的exporter及Grafana Dashboard。
目前本文涉及的监控内容:
- 主机监控
- 容器监控
- Ceph监控
- VMware监控
项目说明
我们假设读者已经使用CentOS搭建了容器环境,并配置了国内源的前提下。如果没有设置请参考《CentOS 7和Docker初始化安装》。
Prometheus快速构建的docker compose原始项目来自stefanprodan/dockprom,但是由于原项目中的cAdvisor使用了Google源,所以Fork的项目修改为国内源xiaoquqi/dockprom。
原项目中包含的组件:
- Prometheus (metrics database) http://
:9090 - Prometheus-Pushgateway (push acceptor for ephemeral and batch jobs) http://
:9091 - AlertManager (alerts management) http://
:9093 - Grafana (visualize metrics) http://
:3000 - Caddy (reverse proxy and basic auth provider for prometheus and alertmanager)
默认包含的采集器:
- NodeExporter (host metrics collector)
- cAdvisor (containers metrics collector)
在此基础上增加的内容:
- Ceph exporter
- VMware exporter
- 钉钉告警webhook
- 轻量级http服务,用于内网分发docker-compse.exporter.yml
环境快速构建
git clone https://github.com/xiaoquqi/dockprom
cd dockprom
docker-compose up -d
启动完成后,用浏览器访问:
- Prometheus: http://yourip:9090
- Grafana: http://yourip:3000
默认的用户名/密码为: admin/admin,如果需要修改可以在启动之前修改docker-compose.yml文件。
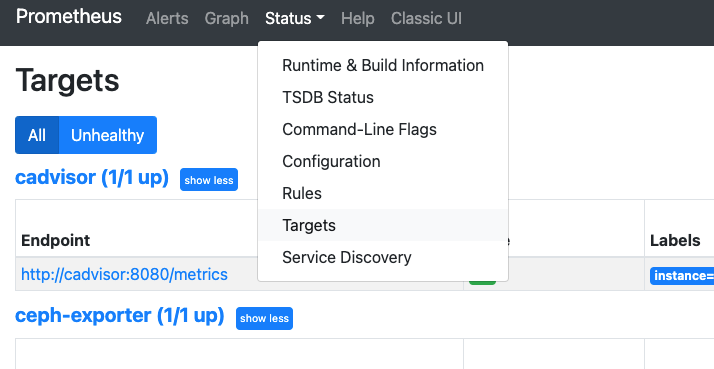
访问Prometheus,查看metrics是否被正确采集。如果有采集器有红色字样,根据提示查看具体的错误原因,大部分的错误都是因为配置问题,或者网络不通造成的。
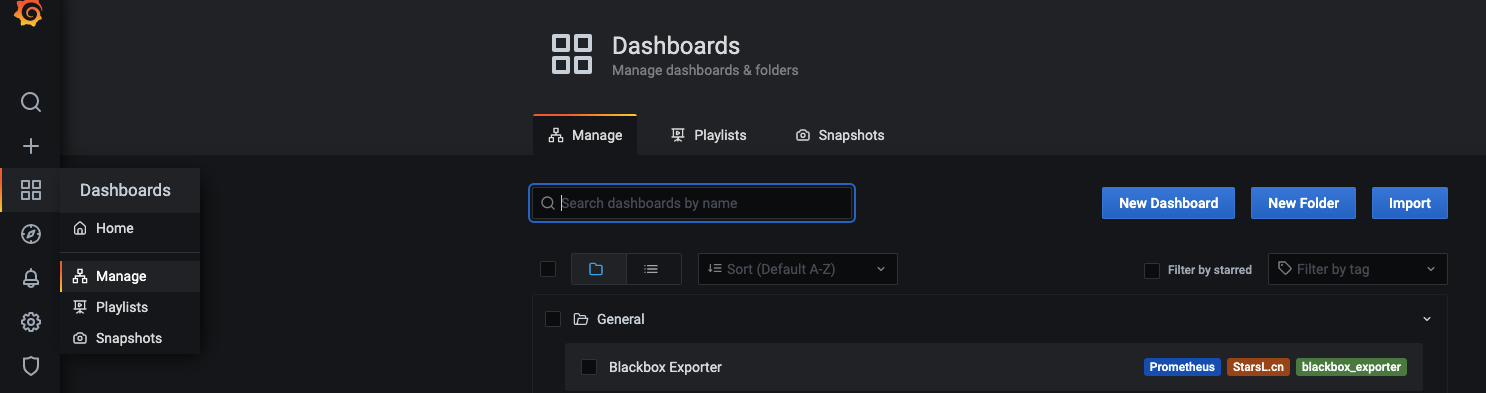
Grafana配置
访问Grafana的控制面板,其中已经内置了一些模板,也可以选择Import导入Grafana模板库的模板,数据源选择已经配置好的Prometheus即可。
主机监控
默认安装情况下,主机层面仅监控了本机,如果需要增加新的监控主机,需要进行以下两步:
- 为主机安装node exporter
- 修改Prometheus配置文件,并重启服务
1、安装node exporter
在项目中,内置了一个单独的docker-compose.exporters.yml,如果目标主机安装了容器,可以直接将该yaml文件拷贝至目标节点后,启动监控服务即可。当然也可以通过软件包安装方式,本文不再赘述。
docker-compose -f docker-compose.exporters.yml up -d安装完成后,访问metrics接口,即代表安装成功
curl http://localhost:9100/metricsnode_softnet_processed_total{cpu="14"} 2.8795339e+07
node_softnet_processed_total{cpu="15"} 2.3535384e+07
node_softnet_processed_total{cpu="16"} 3.4674675e+07
node_softnet_processed_total{cpu="17"} 2.5727501e+07
node_softnet_processed_total{cpu="18"} 2.5931391e+07
node_softnet_processed_total{cpu="19"} 2.67231846e+08
node_softnet_processed_total{cpu="2"} 4.3448998e+07
node_softnet_processed_total{cpu="20"} 3.0684276e+07
node_softnet_processed_total{cpu="21"} 3.0587632e+072、修改Prometheus配置文件
回到Prometheus节点,找到dockerprom/prometheus/prometheus.yml进行如下修改,在nodeexporter段的targets增加新的监控节点后重启服务。
## A scrape configuration containing exactly one endpoint to scrape.
scrape_configs:
  - job_name: 'nodeexporter'
    scrape_interval: 5s
    static_configs:
      - targets: ['nodeexporter:9100', 'newip:9100']
docker restart prometheus告警配置
其实监控并不是最终的目的,往往告警才是监控系统成功与否的关键,在实际运维中对于根因分析和告警收敛是有非常强烈的需求的,本文中暂时还没对此做深入的分析,仅仅提供了常规的告警手段。告警的配置方法有两种方式,一种是通过Prometheus AlertManager,另外一种也可以通过在Grafana上直接进行配置。
对于告警方式支持多种方式,例如我们常用的邮件或者钉钉等,当然你也可以实现你自己的方式,这里我们使用钉钉的WEBHOOK作为告警方式。
1. 钉钉webhook配置
默认已经启动了钉钉容器,只需要修改dingtalk/config.yaml即可。Targets下面有各种示例,比如配置一个最简单的钉钉告警:
targets:
  devops:
    url: https://oapi.dingtalk.com/robot/send?access_token=xxxxx
这里的devops是自定义的,但是和后面要填入alertmanager的链接地址有关,比如本例中alertmanager回调地址就是http://
## 2. 修改AlertManager配置
修改alertmanager/config.yml
route:
  receiver: 'dingtalk'

receivers:
- name: 'dingtalk'
  webhook_configs:
  - send_resolved: true
    url: http://<yourip>:8060/dingtalk/devops/send
这里不要用localhost,因为部署在容器内。
## 3. 修改Prometheus配置文件
修改alert.rules,尝试修改一些规则测试告警,例如:
- name: host
rules:
- alert: high_cpu_load
  expr: node_load1 > 0.2
  for: 1s
  labels:
    severity: warning
  annotations:
    summary: "Server under high load"
    description: "Docker host is under high load, the avg load 1m is at {{ $value}}. Reported by instance {{ $labels.instance }} of job {{ $labels.job }}."
此时可以通过AlertManager查看http://
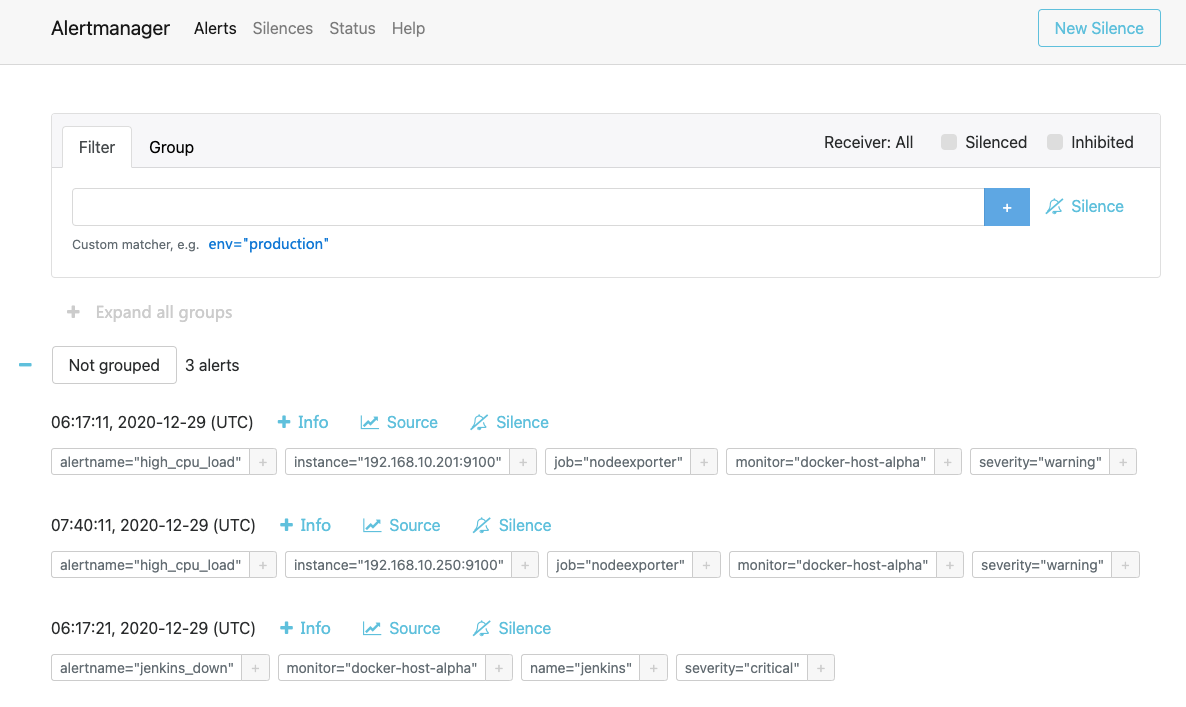
如果告警产生了,但是无法触发钉钉,可以通过检查alertmanager容器进行debug,例如上述提到的localhost问题。
level=warn ts=2020-12-29T07:21:56.345Z caller=notify.go:674 component=dispatcher receiver=dingtalk integration=webhook[0] msg="Notify attempt failed, will retry later" attempts=1 err="Post \"http://localhost:8060/dingtalk/devops/send\": dial tcp 127.0.0.1:8060: connect: connection refused"
level=error ts=2020-12-29T07:26:56.344Z caller=dispatch.go:309 component=dispatcher msg="Notify for alerts failed" num_alerts=1 err="dingtalk/webhook[0]: notify retry canceled after 16 attempts: Post \"http://localhost:8060/dingtalk/devops/send\": dial tcp 127.0.0.1:8060: connect: connection refused"
Ceph监控
确保Ceph配置文件已经在/etc/ceph目录下,并且能够正常访问Ceph集群。
docker-compose -f docker-compose.ceph.exporters.yml up -d通过访问http://
在prometheus/prometheus.yml文件中增加一个新的Job
scrape_configs:
  ......
  - job_name: 'ceph-exporter'
    scrape_interval: 5s
    honor_labels: true
    static_configs:
    - targets: ['192.168.10.201:9128']
      labels:
        instance: Ceph Cluster
最后重启prometheus容器
docker restart prometheus在Grafana中导入三个模板:
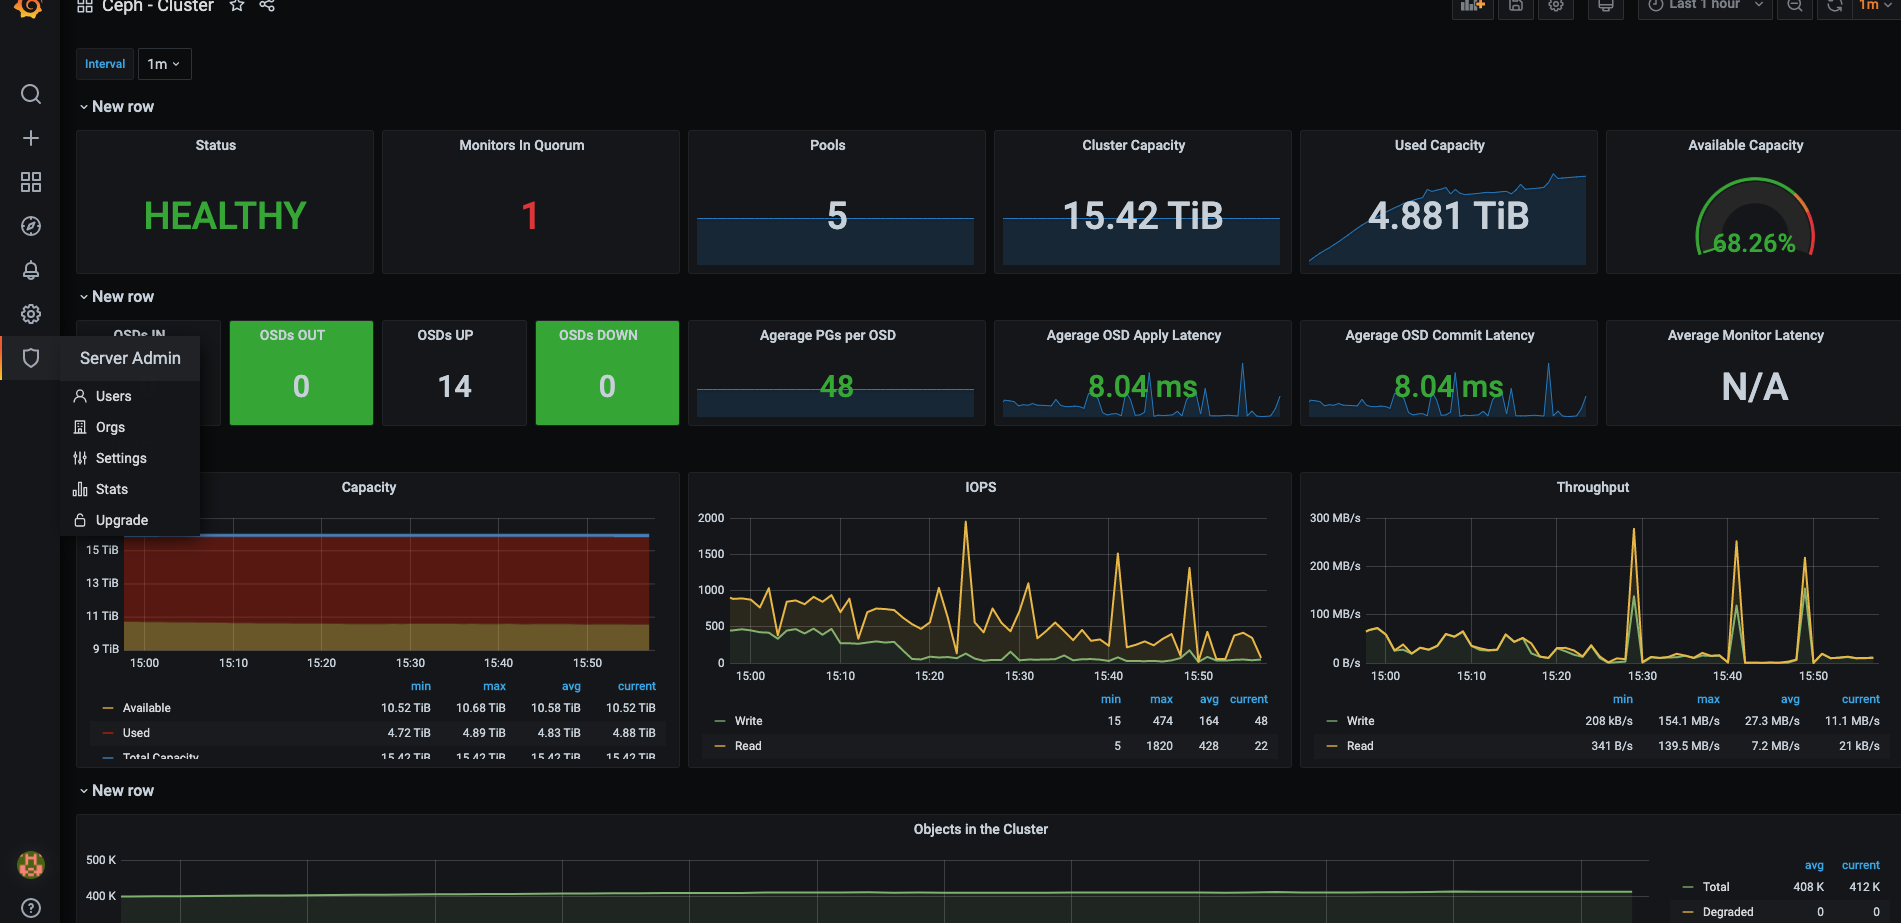
- Ceph Cluster Overview: https://grafana.com/dashboards/917
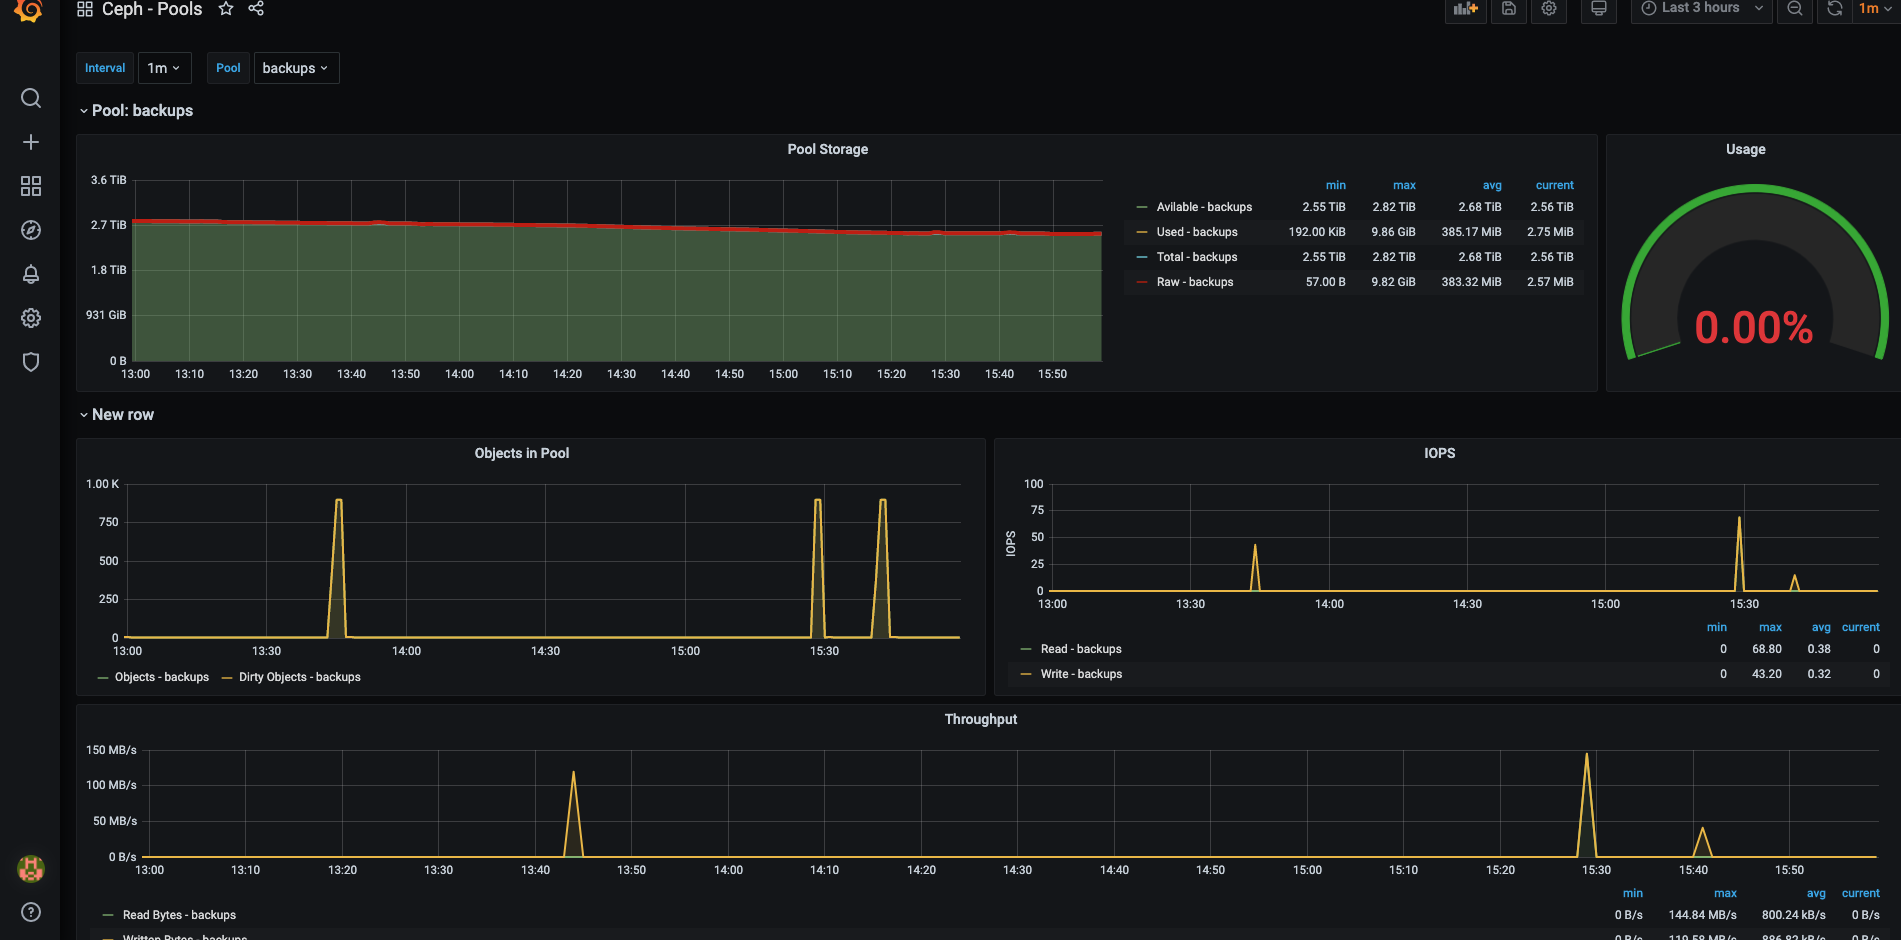
- Ceph Pools Overview: https://grafana.com/dashboards/926
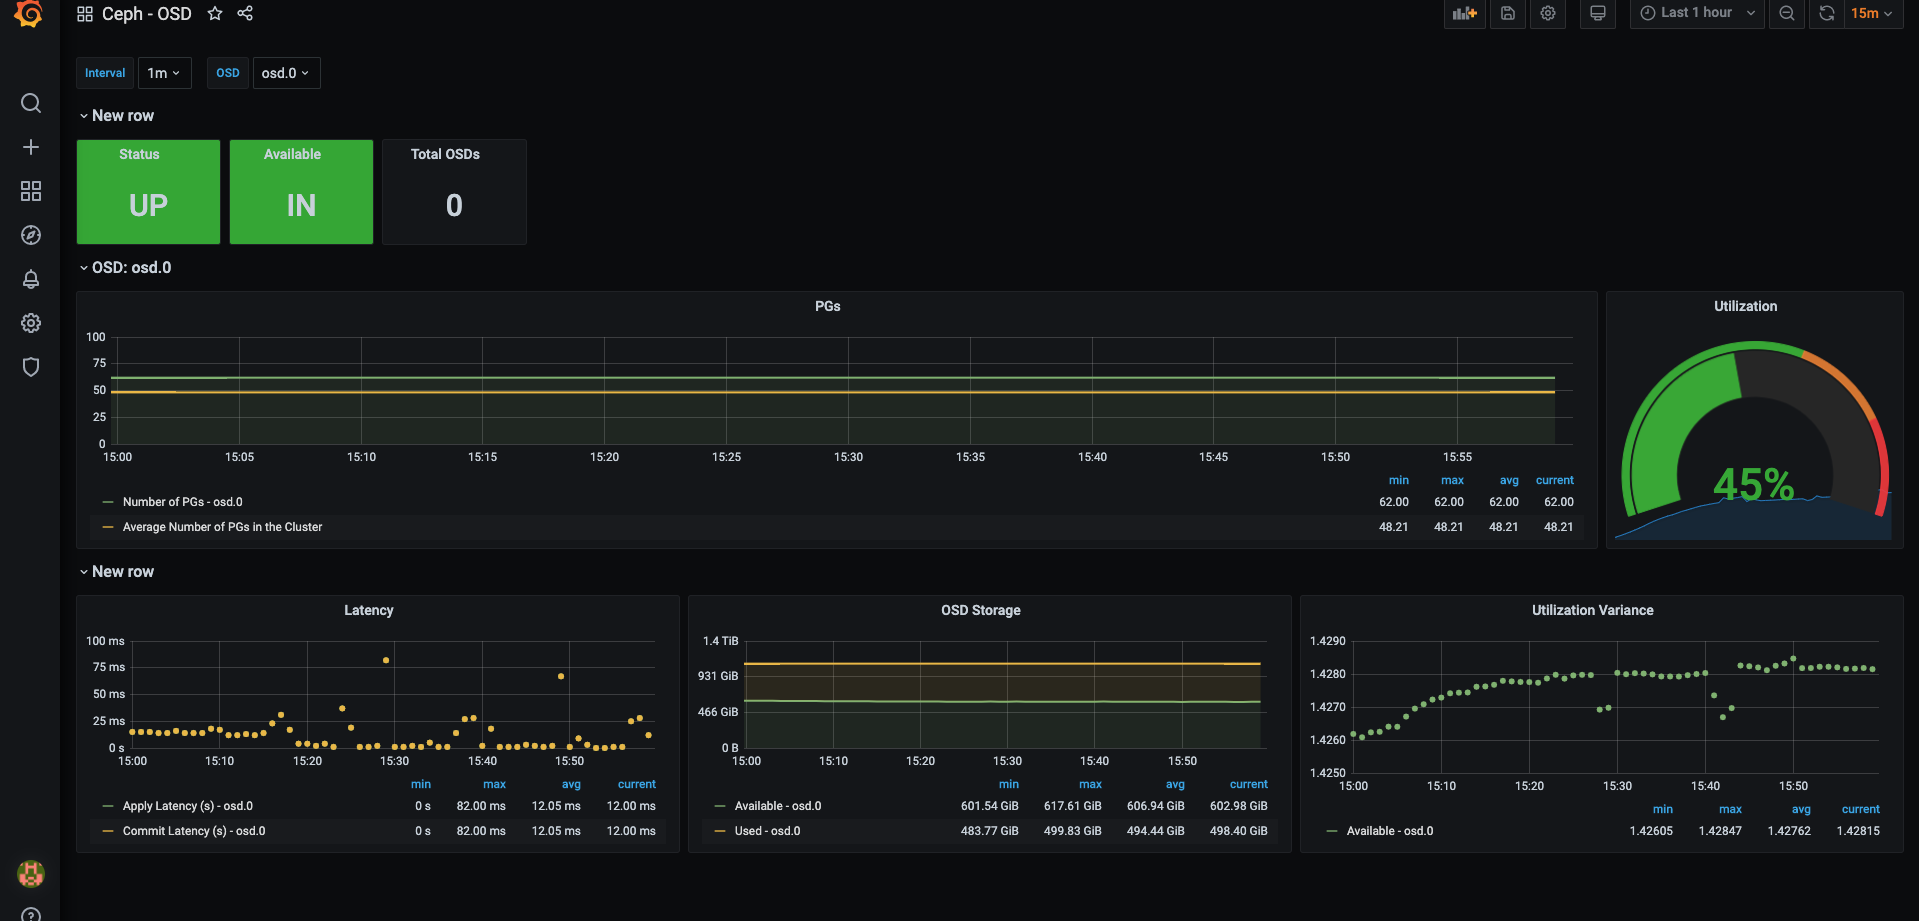
- Ceph OSD Overview: https://grafana.com/dashboards/923
Ceph Cluster效果:
Ceph Pool效果:
Ceph OSD效果:
VMware监控
首先修改docker-compose.vmware.exporters.yml中vcenter的连接信息:
services:
  vmware-exporter:
    image: pryorda/vmware_exporter:v0.11.1
    container_name: vmware-exporter
    restart: unless-stopped
    ports:
       - '9272:9272'
    expose:
       - 9272
    environment:
      VSPHERE_HOST: "VC_HOST"
      VSPHERE_IGNORE_SSL: "True"
      VSPHERE_USER: "VC_USERNAME"
      VSPHERE_PASSWORD: "VC_PASSWORD"
    labels:
      org.label-schema.group: "monitoring"
启动VMware exporter:
docker-compose -f docker-compose.vmware.exporters.yml up -d通过访问http://
在prometheus/prometheus.yml文件中增加一个新的Job
scrape_configs:
  ......
  - job_name: 'vmware_vcenter'
    metrics_path: '/metrics'
    scrape_timeout: 15s
    static_configs:
    - targets: ['192.168.10.13:9272']
最后重启prometheus容器
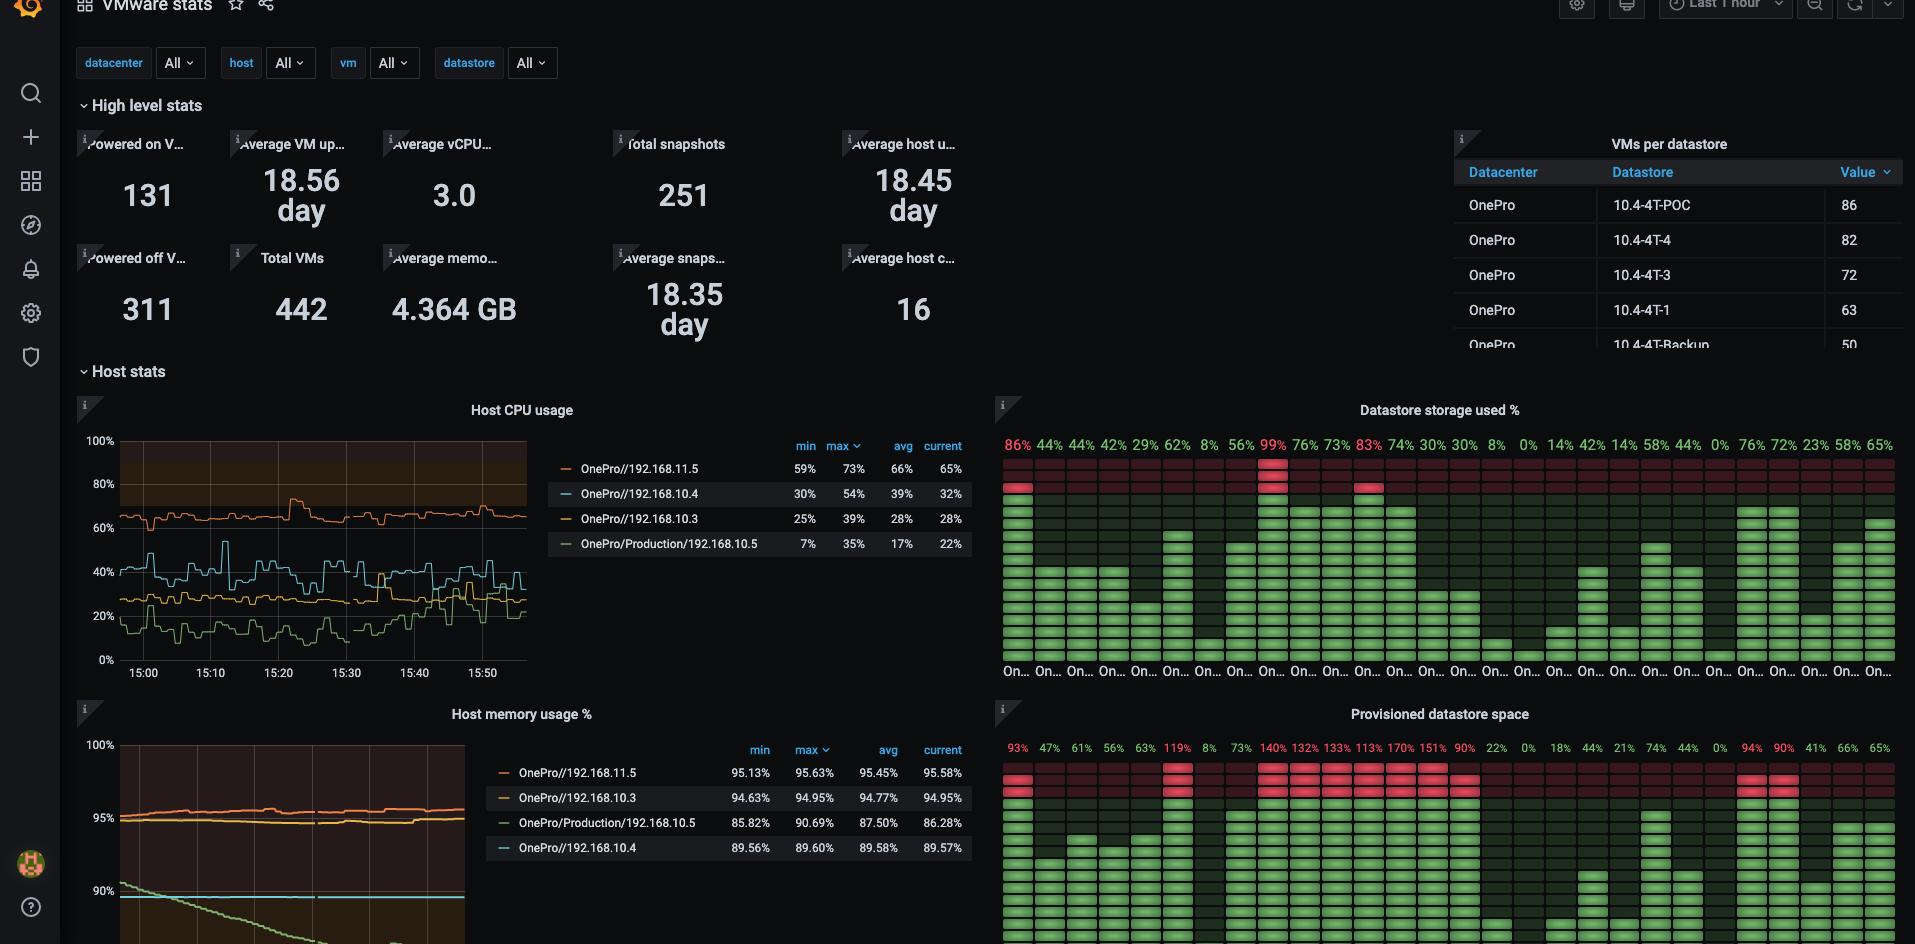
docker restart prometheus在Grafana中导入模板:https://grafana.com/grafana/dashboards/11243
效果如下: